Summary
Our agency was commissioned by a major client to develop a web user interface for their automated analysis tool for 3D-scanned components (frontend and UI/UX). Our solution represents a user-friendly, functionally enhanced and high-performance alternative that we developed iteratively and in close consultation with the client. Through this project, we elevated our competence in programming 3D scenes to a new level. The success of the project was reflected in the client's satisfaction, which ultimately led to being commissioned for another project.
Background and Origin of the Project
The use of Artificial Intelligence (AI) in the automated analysis of 3D-scanned components has revolutionized quality assurance in the manufacturing industry in recent years. Through the use of advanced algorithms, AI can detect the finest deviations and irregularities in 3D scans that often escape the human eye. This technology enables precise and efficient real-time inspection of component quality, minimizes error rates, and thus contributes significantly to improved production standards. However, for effective use of automated analysis, the algorithm must be individually tailored to the specific requirements of a component. This requires a user-friendly configuration interface that allows the algorithm to define the features to be analyzed and mark their tolerances. We at Helm & Walter IT-Solutions were engaged to develop this web user interface.

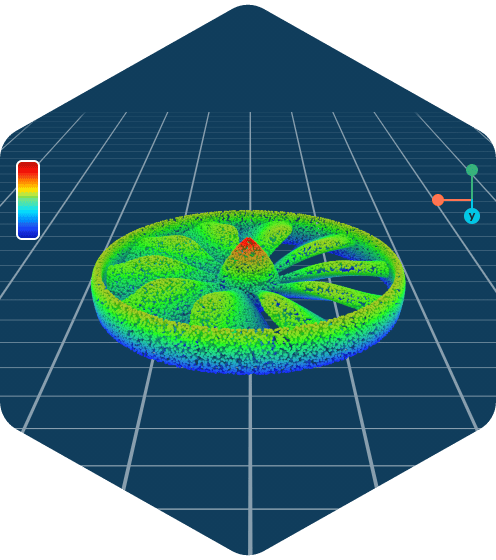
The figure shows the three-stage process of quality inspection of components: First, a laser scan of the component is performed, whose generated 3D model is typically presented as a point cloud in a second step. In the final step, users can configure the analysis tools to be executed by the artificial intelligence algorithm. For example, areas can be marked where the AI should check the workpiece for defects. In our client's case, at the beginning of the project, both the scanning process by the industrial camera and the AI were only available in rudimentary form. The operation of the locally installed tool was exclusively via the command line, which negatively affected user-friendliness and flexibility. A hovering function for deeper analysis of component flaws was also missing, which slowed down the work process. Initially, it was necessary to implement appropriate project management for the web tool. Subsequently, an interactive display of the point cloud should be realized through, for example, hovering or marking, and the application implemented in a web-based format.
Our Services
UI/UX Design
As already described, the starting point for the development of the user interface was a command-line based application that served as a technology demonstrator in a research project. Our goal was to create a better alternative in the form of a user-friendly web interface. This allows users to configure analysis tools and visually evaluate analysis results in a 3D point cloud representation. To achieve this goal, we focused on an iterative design process with feedback loops in which I developed a high-fidelity prototype in AdobeXD. This prototype was made available to the client during development so that they could further develop the algorithm and its application interfaces (APIs) for data transfer.
This iterative approach allowed us to carefully develop the configuration steps for the processing and analysis tools while always keeping user-friendliness in mind. We placed special emphasis on clearly presenting the sequence in which the analysis tools are processed by the algorithm to illustrate the dependencies between the results of the individual tools. Additionally, to reduce waiting times during server-side data processing, we integrated a preview of the tool configurations in the 3D visualization, even before the actual processing takes place on the server. This allows repeated, resource-intensive processing steps for fine-tuning configurations to be avoided. The 3D visualization follows established UI conventions from 3D CAD and modeling applications and offers users intuitive control of the view for efficient evaluation of analysis results.
Web Frontend Development

My task was the frontend development of the user interface as a web application that enables interaction with the point cloud. The goal was to transform the original software, including existing and newly required functionality, into the web application. This required ensuring the seamless integration of the 3D library into the Vue framework and returning changes to the data back to the library. Through a programmed controller, the interaction between Vue and ThreeJS could be abstracted and simplified, which ensured reactivity between the 3D component and the framework. Additionally, I was responsible for solving performance issues to ensure a smooth user experience. Features I implemented included function selection, navigation of the camera view in virtual space, mouse hover information for each point in the cloud, and the selection of objects.
Special Challenges

Import of Various File Formats
JavaScript is based on a single-thread architecture, which means that the JavaScript engine processes the source code in only one execution thread. To maintain the performance of the application even when reading large amounts of data, we implemented a Web Worker. This supports parsing and reading data into arrays in an extra thread in the background. This keeps the application responsive and allows it to perform other tasks in parallel. Despite reading the huge amount of data, the user interface remains user-friendly.

Responsive Handling of Thousands of Data Points
Another special feature of the project was the implementation of Bounding Volume Hierarchy (BVH) for fast processing of data points. This data structure organizes large amounts of 3D data hierarchically by dividing objects into simple geometric shapes, so-called bounding volumes. Mathematically, this is referred to as geometric space partitioning. We significantly reduced the complexity in calculating hover information for a point. Originally, the computational effort was linear, whereas after hierarchization using bounding volumes, it was only logarithmic. Specifically, the solution using hierarchization consisted of checking large areas for collisions or visibility and only then performing more detailed calculations. This significantly reduces the computational effort and improves the performance of the application. For each mouse move event, a comparison is made with a large number of data points in 3D space. Here, the Bounding Volume Hierarchy (BVH) has proven particularly effective. Through the hierarchical structure, it can quickly determine which data points are relevant for the mouse event. In the context of collision detection in 3D space, this reduces the need to directly check a multitude of data points by only examining the areas that actually come into contact with the cursor position.


